 As I was looking a the chart in my previous post (Are You Tired Of Browser Wars?) I realized that even this skim on data can provide enough for cheap marketing analysis. Since we’re not presenting a case study here let’s look at possibilities that small business can extract from data they already have at their possession.
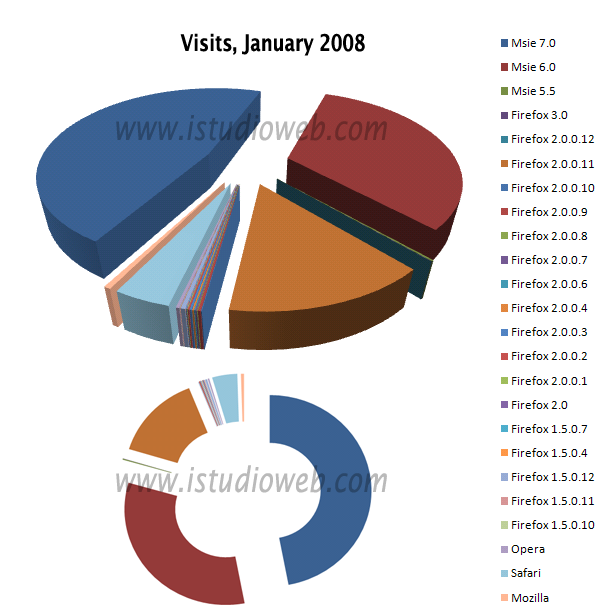
The chart on the left presents the browser shares for this blog. The picture is very different. Internet Explorer has got only 56% of visits with 41% belonging to IE 7 (dark teal piece). Only 15% of you, readers of this blog, hadn’t update your Internet Explorer to the latest version, keeping your version 6 (green piece on a diagram). You are exposing yourself to much more vectors of attack then those who have IE 7. Total share of all Firefox visitors is a whopping 40% (dark orange piece of pie). Of course the picture is a bit skewed by my own visits, since I write posts via WordPress admin. But 40% looks too damn impressive. The little salmon-colored piece is a representation of Safari users – 2%. Opera – less then 1%.
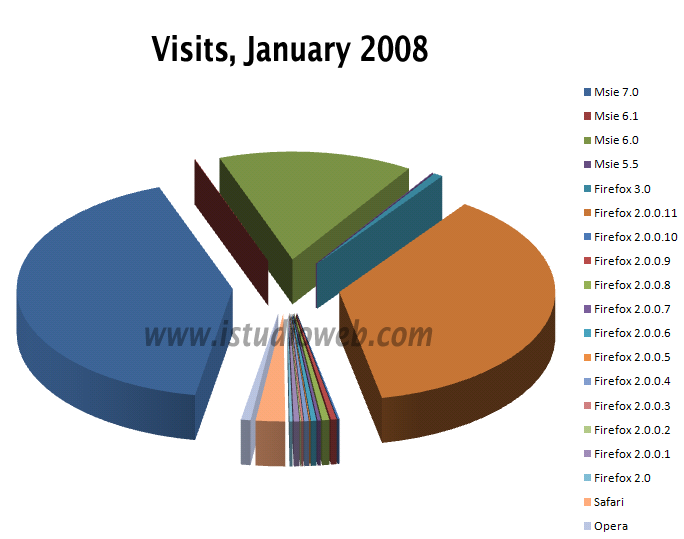
What looks interesting to me is that while this blog is all about small business, most people who read it are much more computer-savvy then visitors to our client’s web site from last post. If you a starting entrepreneur just by looking at your stats you can learn a lot more about your audience. If your audience is computer savvy – you can talk more technical to them, use more sophisticated online selling tools and techniques. If your audience looks like the picture from previous post’s diagram – then you should resort to simple and proven methods, like simple contact form, phone contact, direct mailing and so on.
On the other hand – this may be your chance to find out that despite your efforts the audience that looks at your web site is just the wrong crowd.